
21 Mar January 2018 Labor Area Summary

Kennewick-Pasco-Richland Metropolitan Statistical Area (MSA) not seasonally adjusted unemployment rate was at 7.4 percent in January 2018, which is 1.1 percent lower than in January 2017, while recording 0.8 percent increase from December 2017, according to the estimates by the federal Bureau of Labor Statistics (BLS).
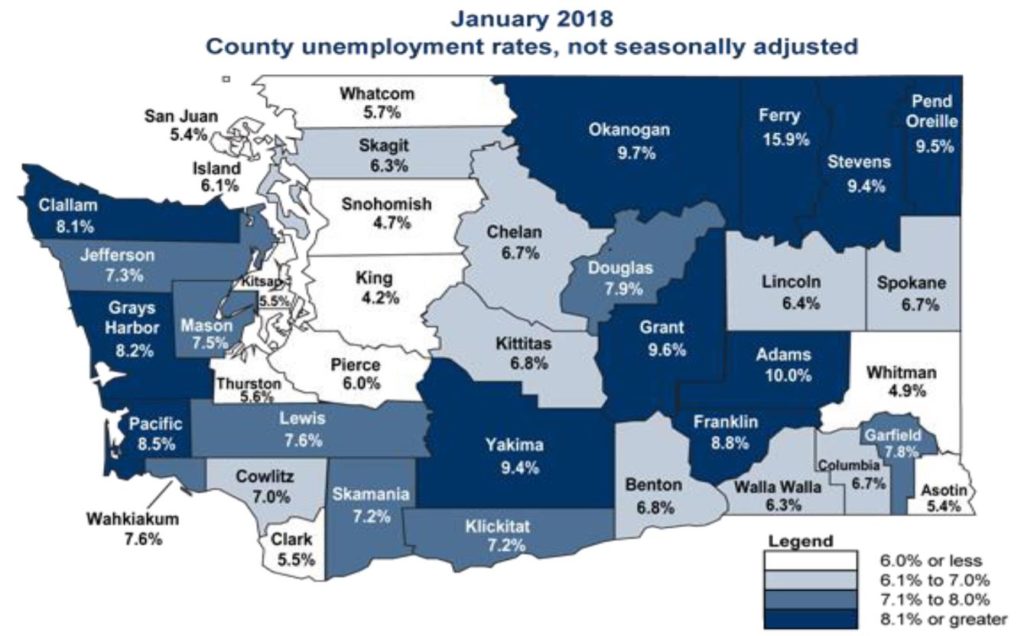
The Benton County unemployment rate was 6.8 percent, while the Franklin County unemployment rate was 8.8 percent in January 2018.The state’s not seasonally adjusted unemployment rate was at 5.6 percent in January 2018.
The state’s seasonally adjusted unemployment rate was at 4.7 percent and nationwide unemployment rate was 4.1 percent in January 2018.
The labor force expanded in January 2018 for Kennewick-Pasco-Richland Metro and across Washington state. The resident labor force rose from 132,279 people in January 2017 to nearly 135,648 in January 2018, which is a 2.6 percent increase over-the-year.
Labor Force Data (Not Seasonally Adjusted) by Place of Residence
| Preliminary |
Revised |
Changes |
%Changes |
||||
|
Jan-18 |
Dec-17 | Jan-17 | OTM | OTY | %OTM | %OTY | |
| Unemployment Rate | 7.4% | 6.6% | 8.5% | 0.8% | -1.1% | ||
| Labor Force | 135,648 | 137,063 | 132,279 | -1,415 | 3,369 | -1.0% | 2.6% |
| Employment | 125,639 | 127,973 | 121,051 | -2,334 | 4,588 | -1.8% | 3.8% |
| Unemployment | 10,009 | 9,090 | 11,228 | 919 | -1,219 | 10.1% | -10.8% |
| Source: Employment Security Department/LMPA; U.S. Department of Labor, Bureau of Labor Statistics, Local Area Unemployment Statistics (LAUS) | |||||||
The labor force is the total number of people, both employed and unemployed, over the age of 16. Labor force continues to expand, which is along with the seasonal down turn in certain industries contributing to the higher unemployment rate. However, labor force expansion is good sign of improving labor force confidence in the local job market.
Kennewick-Pasco-Richland MSA’s unemployed workforce was at 10,009 in January 2018, this was an increase from December to January of 919 or 10.1 percent, while number of unemployed and looking for work decreased by 1,219 or 10.8 percent over-the-year. The Employment Security Department paid unemployment insurance benefits to 3,951 unemployed residents, in amount of $5.3 million, in January 2018.
Over 44.0 percent of claimants fall into two highly seasonal occupational groups, which are construction occupations (23.6 percent) and farming occupations (20.4 percent). Other top occupational groups of claimants were transportation and material moving occupations (9.3 percent), production occupations (8.5 percent), management occupations (7.9 percent) and office and administrative support occupations (6.0 percent).
Non-Farm Employment (Not Seasonally Adjusted) by Place of Work
| Preliminary |
Revised |
Changes |
%Changes |
||||
|
Jan-18 |
Dec-17 | Jan-17 | OTM | OTY | %OTM | %OTY | |
| Total Nonfarm | 112,400 | 113,400 | 107,700 | -1,000 | 4,700 | -0.9% | 4.47% |
| Total Private | 91,800 | 93,100 | 87,800 | -1,300 | 4,000 | -1.4% | 4.6% |
| Good Producing | 16,000 | 16,200 | 14,300 | -200 | 1,700 | -1.2% | 11.9% |
| Service Providing | 96,400 | 97,200 | 93,400 | -800 | 3,000 | -0.8% | 3.2% |
| Total Government | 20,600 | 20,300 | 19,900 | 300 | 700 | 1.5% | 3.5% |
| Source: Employment Security Department/LMPA | |||||||
On a not seasonally adjusted basis, estimates for January 2017 through January 2018 indicate an increase in employment of 91,900 for the state. The private sector added 82,600 jobs while the public sector gained an estimated 9,300 jobs over the year.
Kennewick-Pasco-Richland Metropolitan Statistical Area (MSA) not seasonally adjusted estimates indicate an increase of 4,700 jobs in nonfarm employment for January 2017 through January 2018. This is an increase of 4.4 percent in jobs over-the-year for the metro area. The areas private sector employers added 4,000 while total government employment expended by 700 new jobs over-the-year.
Nonfarm employment is made up of industries that make up super sectors of good-producing which increased by 1,700 new jobs over-the-year or 11.9 percent and service-providing which increased by 3,000 new jobs or 3.2 percent.
In the goods-producing super sectors, construction and manufacturing make up almost even share of total super sector employment. The Kennewick-Pasco-Richland MSA’s construction industry has registered year-over-year job growth of 19.4 percent, which marks 43 months of expansion (from July 2014 through January 2018). This industry provided 8,600 jobs across Benton-Franklin counties in January 2018 versus 7,200 in January 2017.
Real estate market is very tight in the area as we see fewer new and existing homes on the market for sale as seen before in previous years. On the other hand, commercial construction is very active and pulling a much needed growth of jobs in this industry. Manufacturing has expended over the year by 4.2 percent or 300 jobs. Most of the jobs in manufacturing are in food manufacturing, which has gone through different changes in the
past three years that have affected the rate of growth for the rest of manufacturing. Overall, manufacturing employment is stable and growing.
In the service providing super sector, industries added 3,000 new jobs over-the-year. The private segment that has gained the most of jobs over-the-year was private education and health services. Current estimates show that the two industries added 600 or 4.0 percent more jobs over-the-year, bringing a total employment to 15,700 in January 2018.
Second largest job expansion in private segment was in trade, transportation and warehousing adding 600 or 3.2 percent more jobs over-the-year, bringing a total employment in this cluster to 19,400 in January 2018. Over-the-year, leisure and hospitality industry (primarily hotels and restaurants) has added 400 jobs. Financial activities cluster expended by 300 jobs over-the-year, making this 12 consecutive months of stability and job expansion in this cluster. A total employment for this cluster was at 4,100 jobs as of January 2018.
Total government expended by 700 over-the-year, bring in a total employment to 20,600 in January 2018. Most of the job growth come from local government.
Private Non-Farm Hours and Earnings (Not Seasonally Adjusted) by Place of Work
| Preliminary |
Revised |
%Changes |
|||||
|
Jan-18 |
Dec-17 | Jan-17 | %OTM | %OTY | |||
| Average Weekly Hours | 36.6 | 36.4 | 35.0 | 0.6% | 4.6% | ||
| Average Weekly Earnings | $1,085.56 | $1,065.05 | $1,020.60 | 1.9% | 6.4% | ||
| Average Hourly Earnings | $29.66 | $29.26 | $29.16 | 1.4% | 1.7% | ||
| Source: Employment Security Department/LMPA; Bureau of Labor Statistics/CES |
|||||||
Average hours and earnings of all employees on private nonfarm payrolls are available in three series-average weekly earnings, average hourly earnings, and average number of weekly hours- for Total Private employees in Washington state and its Metropolitan Statistical Areas.
Kennewick-Pasco-Richland MSA average hourly earnings in January were at $29.66, which is the second highest in the state among 11 metropolitan areas. The highest average hourly earnings were in Seattle-Tacoma-Bellevue metro area at $36.42. Metro area has gained in both average weekly hours as well as in average weekly earnings over-the-year.
For more data and information please visit Labor Area Summaries page on our ESD.WA.GOV/labormarketinfo